

Meta description: Zone 2 is a place in your metabolism, not a heart rate. Here is what the research says about defining it, why a fixed number like 150 can mislead, how to find yours with or without a lab, and what changes for women through the menstrual cycle and menopause.
Spend five minutes in any running forum and you will see it: "My Zone 2 is around 150." Someone replies that theirs is 128. A third person says they stopped trusting their watch's zones entirely. All three can be right, and all three can be wrong, because a heart rate number on its own does not tell you which zone you are in.
This article explains what Zone 2 is defined to be, how it is measured, what is wrong with the common shortcuts, and how to find a defensible estimate of your own when a lab is not an option. It is built on peer-reviewed studies wherever they exist, and it says plainly when the evidence is thin or contested. After each batch of research you will find a "What this means for you" note, so the science always lands on something you can do.
The short version
- Zone 2 is a state, not a number. In training talk it means the top of easy aerobic effort, just below your first physiological threshold.
- 150 can be right for one runner and too hard for another. Max heart rate, threshold heart rate and fitness differ a lot between people, and age formulas carry wide error.
- There is a ladder of ways to find yours. A lab test is best, a handheld lactate meter is a cheaper estimate, and the talk test, a drift test and HRV methods are free checks. Using two or three together beats trusting one.
- Your zone moves. It shifts within a long run, with age, and for women through life stages, so treat it as something you re-check, not something you set once.
- Zone 2 is a useful tool, not magic. The evidence for its special powers is contested.
- Most of your running should be easy, but not all of it. Studies of runners from 5K to the marathon point to roughly 70 to 85 percent easy running, with a smaller share of harder work for speed. How you split it depends on your level and goal (Part 2).
How to read this article. Parts 1 to 3 apply to everyone: what Zone 2 is (Part 1), where it fits in your training by level and goal (Part 2), and how to find yours (Part 3). Part 4 is for women only (menstrual cycle, perimenopause and postmenopause), and everyone else can skip straight to Part 5. Part 5 shows how Fit PA fits in.
Part 1: What the research says
"Zone 2" means two different things
The first source of confusion is the label itself. Most watches use a five-zone model, with zones set as percentage bands of maximum heart rate. Garmin's manual, for example, says zones are generally calculated as percentages of max heart rate, with bands starting at 50 to 60, 60 to 70 and 70 to 80 percent [1]. Exercise physiologists often use a three-zone model instead, anchored by two physiological thresholds. The first is where lactate begins to rise above resting values (LT1, or its breathing equivalent, VT1). The second is where lactate accumulation outpaces clearance (LT2 or VT2) [2]. In this model, Zone 1 is everything below the first threshold, Zone 2 sits between the two thresholds, and Zone 3 is above the second [2][3].
That means the "Zone 2" in a podcast about mitochondria and the "Zone 2" in a three-zone paper are not the same intensity. The first is the upper part of easy aerobic running, just under the first threshold. The second is the moderate-to-hard middle ground. One practical write-up notes that zones one and two on a five-zone watch both sit below the first threshold, and nothing measurable in the body separates them [3]. When people say "Zone 2 training" today, they almost always mean the highest intensity you can sustain while still below that first threshold. What this means for you: when you read or hear "Zone 2," ask which system it refers to. For training purposes, the useful meaning is "the highest effort that is still below my first threshold."
Five zones, six zones, seven zones: the count is a labeling choice
Watch brands do not agree on how many zones there are. The Garmin manual cited here (for the fenix 6 series) describes five zones set as percentage bands of max heart rate [1]. Suunto's support page for the Suunto 5 also describes five zones [25]. Other models from these brands may differ. COROS offers three models (threshold heart rate, heart rate reserve and max heart rate), and its own guide says each one has six zones. Zones 1 to 4 follow the standard model, and the fifth is split into Anaerobic Endurance and Anaerobic Power so hard intervals can be structured more precisely [24]. In its threshold model, COROS Zone 2 (Aerobic Endurance) is 80 to 90 percent of threshold heart rate [24].
Seven zones are best known from Andy Coggan's power levels, which run from Active Recovery to Neuromuscular Power and are defined as percentages of threshold power, not heart rate [26]. One cycling coach's explainer makes the general point: every zone model is built on the aerobic and anaerobic thresholds, more zones just give finer labels to one continuous spectrum, and adjacent zones can produce similar adaptations [27].
What this means for you: "Zone 2" on a five-zone watch, a six-zone watch and a seven-level power chart are not guaranteed to be the same effort. Each model is only as good as the number it is anchored to (max heart rate, heart rate reserve or threshold heart rate), so check which model your watch uses and how its anchor number was set before comparing zones with anyone else. No study was found testing how closely each brand's Zone 2 lines up with a lab-measured first threshold.
The physiological definition
Dr. Iñigo San Millán, the physiologist most associated with popularizing the term, defines Zone 2 by blood lactate rather than by heart rate: the intensity where lactate sits at roughly 1.5 to 2.0 mmol/L, with lactate being produced but cleared by mitochondria about as fast as it forms [4]. A 2025 review that examined the claims around Zone 2 summarized the popular definitions as three overlapping ideas: the intensity of maximal fat oxidation (FATmax), blood lactate just below LT1 (about 1.7 to 2.0 mmol/L), and the ability to hold a comfortable conversation [5].
Notice what is missing from every definition: a heart rate. Heart rate is how the body's response shows up on your wrist. It is not the threshold itself.
What this means for you: your goal is not to hit someone else's number. It is to find the heart rate and pace that match this state in your own body, which is why the rest of this article is about ways to find it.
Why one number cannot be right for everyone
Four separate problems make a fixed heart rate unreliable. 1. Maximum heart rate is hard to predict. The familiar "220 minus age" formula has an error standard deviation of about 12 beats per minute, which means roughly 95 percent of people fall within 24 beats of the prediction, a 48-beat window [6]. A 2025 exploratory study of endurance athletes (using self-reported data, so treat it as indicative) found that age-based formulas underestimated their maximum heart rate by about 5 to 6 beats on average, with wide individual limits of agreement [7]. The average bias is less of a problem than the spread. Two runners the same age can have very different true maximums. In practice: any zone built as a percentage of a formula-based max starts from a shaky base.
2. Fixed percentages miss the threshold. A 2020 study of 100 people (46 women, 54 men) compared fixed-percentage prescription methods against the lactate threshold and maximal lactate steady state measured in the lab. Its conclusion was that fixed-percentage methods conform poorly to the true intensity domains and do not adequately control the metabolic stimulus. It also found the lactate threshold occurred at a higher percentage of both VO2max and maximum heart rate in women than in men [8]. A 2025 study in cyclists measured the variability of common Zone 2 markers directly and found coefficients of variation between 6 and 29 percent. VT1 and FATmax tracked each other closely, while fixed percentages of maximum heart rate and blood lactate thresholds showed wide individual differences [9]. In practice: even with a perfect max, "70 percent of max" lands at a different place relative to your threshold than it does for your training partner.
3. The same zone is a different effort in different bodies. A 2025 review notes that the upper boundary of the moderate domain ranges from roughly 24 to 80 percent of VO2max depending on fitness and training status. In absolute terms, Zone 2 can be about four times resting metabolic rate for a sedentary person, such as brisk walking, or more than ten times for an endurance athlete riding around 300 watts [5]. In practice: a fit runner's Zone 2 can be quick and a newer runner's Zone 2 can be a walk or a very slow jog, and neither is wrong.
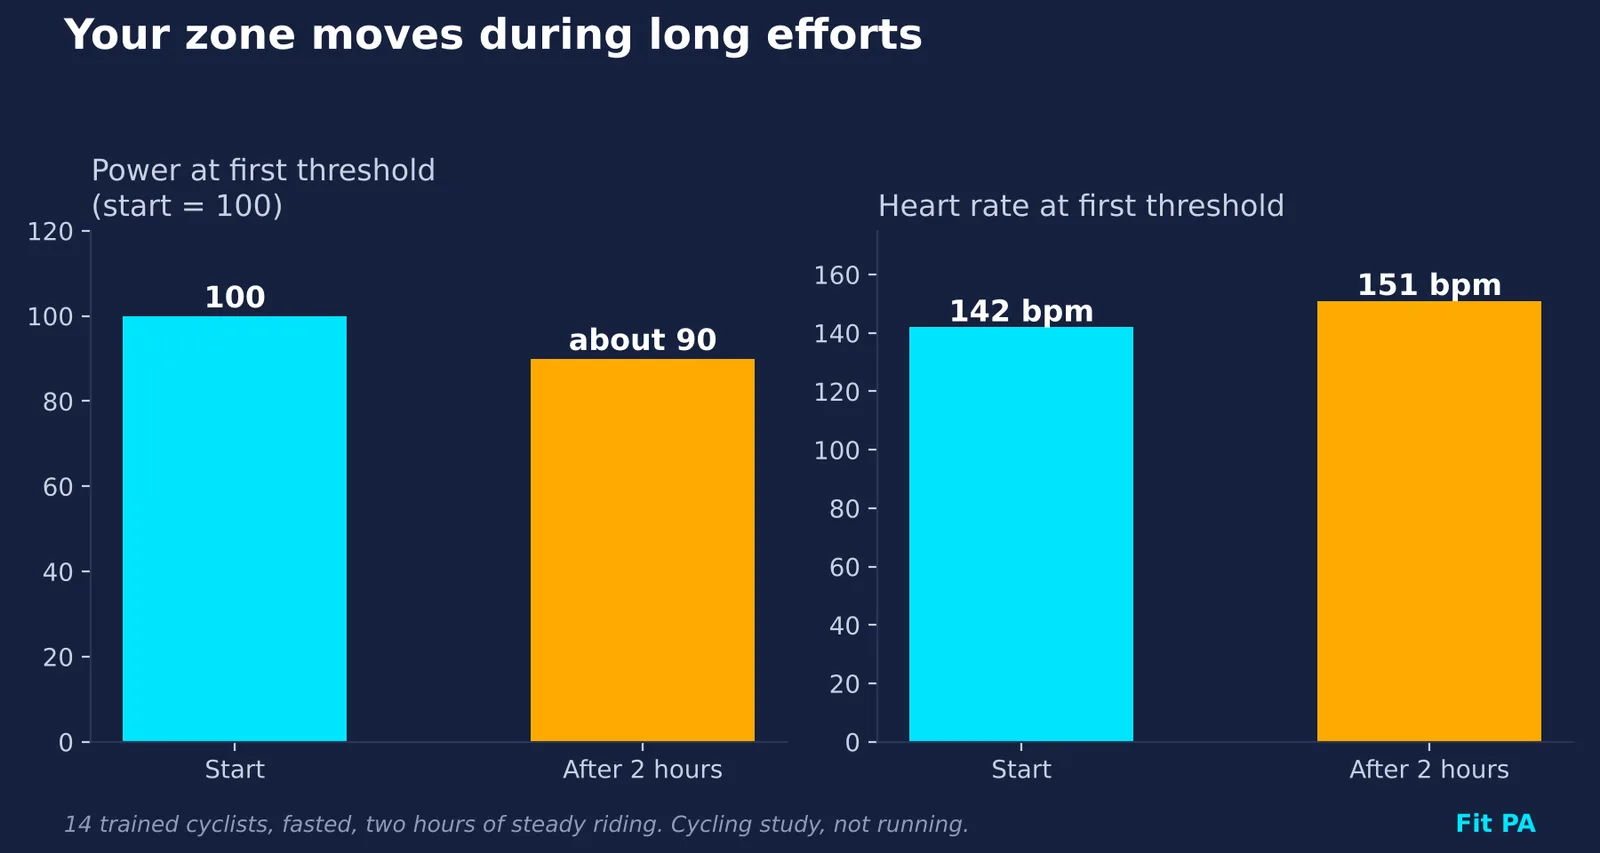
4. Your Zone 2 heart rate moves during the session. In a study of 14 trained athletes (13 men, 1 woman), two hours of cycling at 90 percent of VT1 power in a fasted state reduced the power at VT1 by about 10 percent, from 217 to 196 watts, while heart rate at VT1 rose from 142 to 151 beats per minute. Individual declines ranged from 9 to 44 watts [10]. Athletes in that study were not fed during the ride, so real-world numbers may differ, but the direction matters. The longer you go, the more heartbeats the same pace costs. This is often called cardiac drift. Coaches also note that threshold heart rates shift with day-to-day recovery state [11]. In practice: a single heart rate cap can be too loose at the start of a long run and about right at the end, so on long runs watch the trend, not just one number.
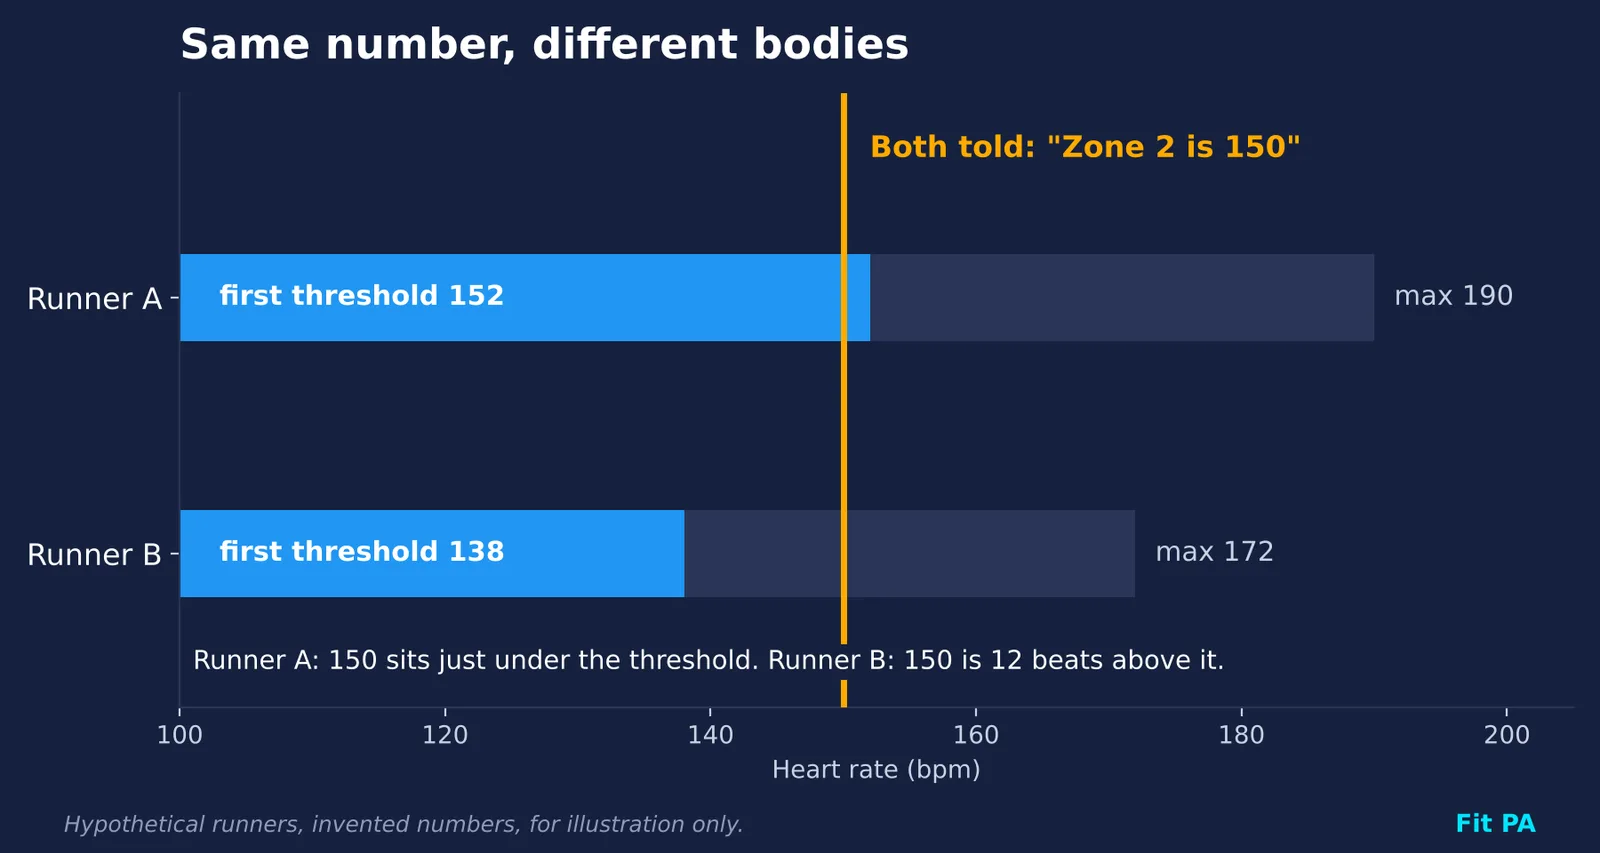
Putting it together: why "150" tells you so little. Here are two hypothetical runners, with invented numbers for illustration only, not from a study:
| Runner A | Runner B | |
|---|---|---|
| Max heart rate | 190 | 172 |
| Heart rate at first threshold | 152 | 138 |
| What 150 means | Just under the first threshold: true Zone 2 | 12 beats above it: a harder effort, likely to drift upward and be tougher to recover from |
Both runners can truthfully say "my Zone 2 is around 150" if they guess, and only one of them is right. The number alone cannot tell you which. Only a measurement of your own threshold, or a field check that approximates it, can.
What this means for you: stop asking "what heart rate should I run at?" and start asking "where is my first threshold?" Part 3 shows how to estimate it.
How Zone 2 is measured, and where each method falls short
| Method | What it tells you | Where it is strong | Where it falls short |
|---|---|---|---|
| Blood lactate step test | Lactate response at each stage, used to find LT1 | The classic reference for the lactate-based definition | There are many definitions of LT1 (a fixed 2.0 mmol/L is common but not universal), and protocol choices change the result [5][12]. Lactate reflects both production and clearance, so it is an indirect window [13] |
| Gas exchange test (VT1) | The first breathing threshold during a ramp test | Tracks closely with FATmax [9]; lab-grade | Needs equipment and a trained operator; day-to-day variation in threshold measures tends to be higher than for max heart rate [14] |
| Fat oxidation test (FATmax) | The intensity where fat burning peaks | Direct to the metabolic idea behind Zone 2. Show notes from a Peter Attia and San Millán conversation call fat oxidation measurement the gold standard [13] | Also lab-only. In sedentary people, FATmax can fall above Zone 2 [5] |
| Field lactate test with a portable meter | Lactate at each stage of a stepped run, measured by finger-prick | Far cheaper than a lab. Portable analyzers correlated strongly with laboratory methods (r = 0.95 to 0.99) in a review of 25 studies [28] | Several models drift above about 6 mmol/L (less relevant to a first-threshold test), most evidence is lab or controlled settings, and the LT1 definition problem remains [28][29] |
| Talk test | Whether you can speak comfortably | Free. Comfortable speech tracks below VT1, becomes equivocal at VT1, and speech is impossible near the second threshold [15]. It has also tracked changes when researchers lowered or raised VT1 experimentally [15] | In one study, VT1 values sat lower than the talk-test stages, so comfortable speech may sit a little above VT1 [16] |
| %HRmax, heart rate reserve, "220 minus age" | A population-average guess | Needs no testing | Individual error is large. In a 12-week trial of 36 adults, prescribing by VT1 and VT2 reduced individual variation in VO2max response compared with a heart rate reserve method [17] |
| HRV threshold (DFA a1 of 0.75) | An estimate of VT1 from beat-to-beat heart rate data | A 2021 study found DFA a1 reaching 0.75 on a treadmill ramp was closely associated with crossing VT1 [18]. A 2024 meta-analysis found very strong agreement with LT1 and VT1 (r = 0.85) [19] | Newer, and depends on clean beat-to-beat data from a chest strap or similar sensor |
| Heart rate drift test | Whether a steady pace stays aerobic over an hour | Free and repeatable | Coach-developed protocol (see Part 3). No independent validation against lab testing was found |
What this means for you: think of these methods as a ladder. A lab test sits at the top, a portable lactate meter is next, free field checks come after, and formulas sit at the bottom. Climb as high as your budget allows, and where you cannot, combine two or three lower rungs, because their errors are different and can cancel out.
Is Zone 2 as powerful as the internet says?
This is where the evidence is genuinely contested, and an honest article should say so. In San Millán and Brooks's 2018 study, professional endurance athletes had significantly higher fat oxidation and lower blood lactate during exercise than moderately active people and people with metabolic syndrome. The authors proposed measuring lactate and fat oxidation during exercise as an indirect way to assess metabolic flexibility and oxidative capacity [20]. That work is the backbone of the case for Zone 2.
A 2025 narrative review in Sports Medicine by Storoschuk, Moran-MacDonald, Gibala and Gurd challenged the stronger claims. It concluded that current evidence does not support Zone 2 as the optimal intensity for improving mitochondrial or fat oxidative capacity, noted that few studies explicitly tested Zone 2 as it is popularly defined, and argued that elite athletes also do plenty of high-intensity work, so their large mitochondrial capacity cannot be pinned on low-intensity volume alone. It also found that Zone 2 does appear to improve fat oxidation in untrained people, and cautioned that for people squeezing in limited training time, higher intensities are likely important for cardiorespiratory fitness [5]. Two caveats on that review: it is a narrative review rather than a systematic one, and it focuses on the general population rather than on endurance athletes.
Where both sides converge: low-intensity work is a real tool, but not a magic one. Stephen Seiler's research on elite endurance athletes documented that they spend most of their training time at low intensity, which is a description of what they do, not a prescription [2][3]. A 2023 intervention study even reported that durability, meaning how well your physiology holds up over long efforts, improved with both low and high intensity endurance training [21].
What this means for you: easy running is worth doing, because it builds volume you can recover from, but you do not need to agonize over a few beats, and you should not expect it to replace harder sessions. If you are short on time, the evidence says some higher-intensity work matters too. A reasonable reading is: most of your running easy, some of it hard, and an easy zone that is honestly easy. Part 2 goes through how much, and how it changes with your level and goal.
Part 2: Where Zone 2 fits in your training
Finding your zone is half the job. The other half is knowing what to do with it: what it gives you, how much of it to do, and how it combines with harder running. This part covers all of that, using studies in runners from 5K to the marathon wherever they exist. One translation to keep in mind. In most of the studies below, "low intensity" or "Zone 1" means everything below the first threshold, which includes very easy jogging. Popular "Zone 2" is the upper part of that range. So when research says "about 80 percent easy," it means easy running of all kinds, not 80 percent pinned to the top of the easy range.
What easy running (Zone 2) is good for
What the research supports:
- It improves fat oxidation in untrained people. The 2025 review found this effect for Zone 2 in untrained adults [5].
- Easy volume is what separates faster runners. In training data from 151,813 marathons (119,452 runners, Strava data, 16 weeks before each race), the fastest runners trained more than three times the weekly volume of slower runners, and they built that volume mainly by adding easy running. Marathon time was strongly linked to total volume and to the share of time spent easy, while the shares of moderate and hard running were linked to slower times. This is observational data, so it shows association, not cause [44].
- Elite runners do most of their running easy. A review of world-class 5000 m, 10,000 m and marathon training found at least 80 percent of running volume is low intensity throughout the year [46]. Seiler's review of nationally and internationally competitive endurance athletes likewise found about 80 percent of sessions at low intensity [39].
- It pairs well with a few hard sessions. Seiler concluded that a large base of low-intensity work combined with fewer hard sessions supports adaptation and technical skill while keeping training stress acceptable [39]. Another review notes that excessive threshold training may offer no further benefit and can strain recovery [40].
- In one small study of eight sub-elite runners, time spent at low intensity over a 6-month build was strongly correlated with faster race times (r = -0.97 for a 10 km race, r = -0.79 for a 4 km race). It was correlational and tiny, so it supports the pattern but does not prove it [45].
What is not established: that Zone 2 is the best intensity for building mitochondria or fat-burning capacity. The 2025 review found current evidence does not support that claim, and few studies tested Zone 2 as it is popularly defined [5]. Health guidelines, such as the World Health Organization's recommendation of at least 150 minutes of moderate-intensity activity a week for adults, are framed in terms of moderate activity and not training zones [49].
What this means for you: easy running is valuable because it lets you accumulate volume you can recover from, and volume is what the fastest runners in the data have in common. Do it for that reason, not because of any special mitochondrial magic.
Do you need harder running too?
Almost certainly yes if you want to get faster. Here is what the runner studies show:
- Recreational runners, 10 weeks (30 runners): a mostly easy distribution (about 77 percent easy, 3 percent moderate, 20 percent hard) was compared with a moderate-heavy one (about 46, 35 and 19 percent). Both groups improved their 10 km time significantly (5.0 percent versus 3.6 percent), and the difference between groups was not statistically significant. A secondary analysis of runners who followed their plans most closely favored the easy-heavy group, but that rests on a small subset [41].
- Well-trained runners, 16 weeks (60 men, matched training load): pyramidal (about 78 percent easy, 15 percent moderate, 7 percent hard) and polarized (about 80, 6 and 14 percent) both improved performance. Switching from pyramidal to polarized midway gave the largest 5 km and relative VO2peak gains (about 1.5 percent and 3 percent), though most changes were smaller than the smallest detectable change [42].
- A systematic review of 20 runner studies: programs with high volumes of low-intensity work, whether pyramidal or polarized, produced larger endurance gains than threshold-heavy programs, and a mix of roughly 70 percent high-volume low-intensity training with roughly 30 percent low-volume threshold and high-intensity work appeared necessary to optimize adaptations [43].
- Interval training and VO2max: in a meta-analysis of 28 trials (723 healthy adults), steady endurance training and high-intensity intervals both produced large VO2max gains, and intervals gave a possibly small extra gain, larger in people with lower starting fitness [48]. In an 8-week study of 40 male students with matched total work, two interval protocols raised VO2max more (8.1 percent and 6.1 percent) than long slow distance or threshold running, while running economy improved equally in all groups. That result is from a conference abstract [47].
- The other side: in already well-trained athletes, studies that added more high-intensity work did not show convincing long-term performance gains [39]. And a review concluded an "optimal" distribution cannot be identified yet, with wide individual variation [40].
No study found here tested Zone 2 only against a mix of easy and hard running in runners, so there is no direct evidence that Zone 2 alone makes you faster. What this means for you: to run faster, you need some hard running, because intervals and tempo work train speed and VO2max directly, and easy running is the volume that lets you absorb them. The evidence favors a mix with most of your running easy over either extreme. Pyramidal and polarized layouts performed similarly in the trials, so which one you pick matters less than keeping easy days easy and hard days hard.
How much of your running should be easy?
Across these sources, the share of easy running sits in a fairly narrow band:
| Source | Who | Easy share |
|---|---|---|
| Seiler review [39] | Nationally and internationally competitive endurance athletes | About 80 percent of sessions |
| Haugen et al. [46] | World-class 5000 m to marathon runners | At least 80 percent of volume, year-round |
| Esteve-Lanao [45] | Eight sub-elite runners | About 71 percent of time (calculated from the paper's minutes) |
| Muñoz [41], Filipas [42] | Recreational and well-trained runners in trials | About 77 to 80 percent |
| Runner systematic review [43] | 20 studies | Roughly 70 percent high-volume low-intensity, 30 percent harder |
| Muniz-Pumares [44] | Marathoners | Pyramidal most common, in over 80 percent of the fastest |
So the range seen in practice is about 70 to 85 percent easy. Two cautions. First, these describe what athletes do or what small trials tested, not proven prescriptions, and Seiler is explicit that the 80 percent describes athletes who train 10 to 13 times a week. Second, "80 percent" is sometimes counted in sessions and sometimes in time, which are different things.
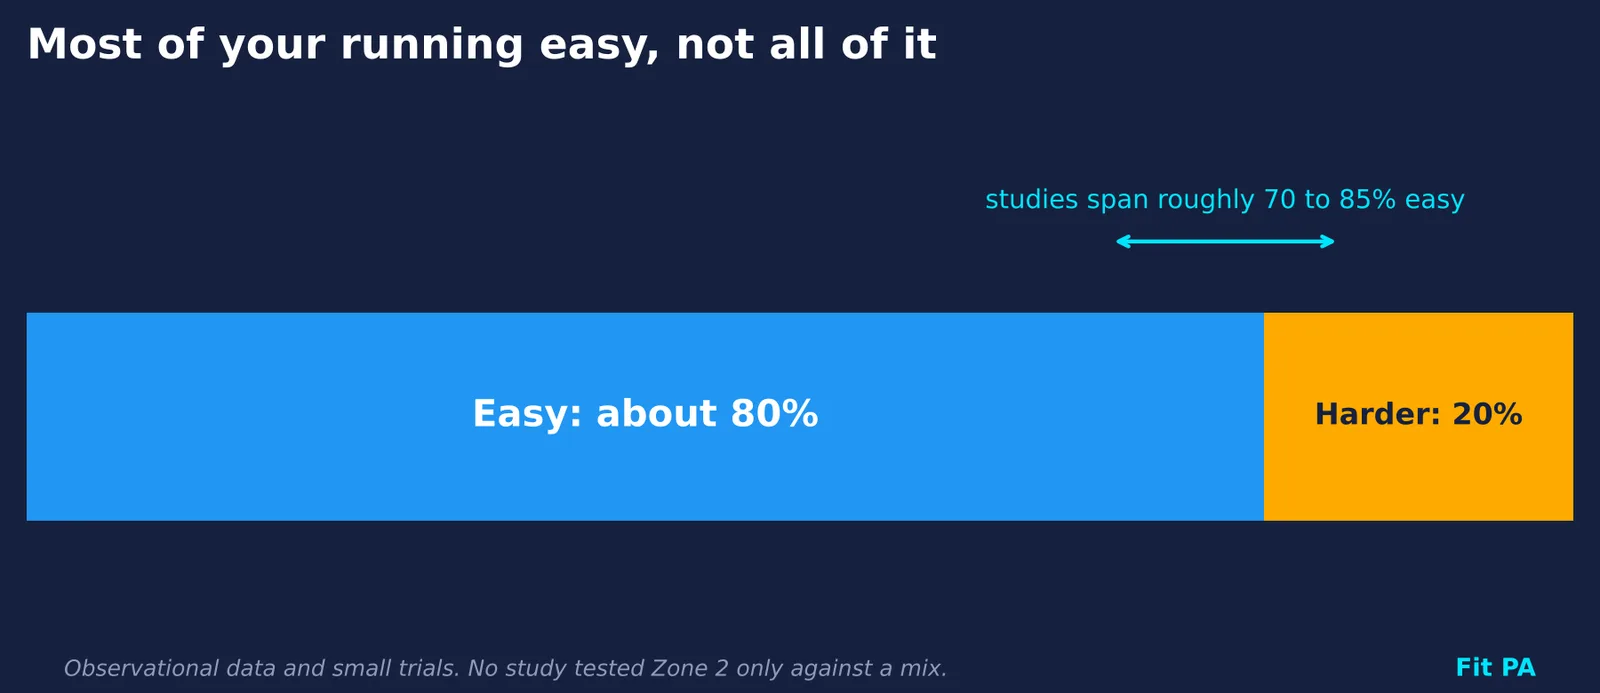
What this means for you: as an illustration only, if you run four days a week, that is typically three easy runs and one run with some harder work. If you run three days a week, it might be two easy runs and one quality session. These are examples built to match the proportions above, not tested plans.
Does it depend on your level?
The studies do not split results neatly by beginner, intermediate and advanced, so the table below is a reasonable reading of the evidence, not something tested directly.
| Level | What the evidence suggests | What this means for you |
|---|---|---|
| Beginner (new to running or returning) | Zone 2 improves fat oxidation in untrained adults [5]. Intervals add a possibly small VO2max gain, larger in lower-fitness people [48]. Health guidelines are framed as 150 minutes of moderate activity a week [49]. | Zone 2 for a beginner can be a brisk walk or a walk-run mix, and that is fine. Focus on regularity and volume you can recover from. Add small amounts of harder work once running feels routine. |
| Intermediate (consistent runner, targeting a race time) | Both pyramidal and polarized layouts improved performance in trials of recreational and well-trained runners [41][42]. | Keep most runs easy and add one or two quality sessions a week, such as intervals or a tempo run, depending on how much you run. |
| Advanced (high weekly volume, chasing small gains) | Volume is the differentiator in marathon data [44]. Elite runners keep at least 80 percent easy and add race-pace work as races approach [46]. Extra high-intensity work in already well-trained athletes did not show convincing gains [39]. | Protect easy days from creeping faster. Gains come from consistency and specificity, not from making every run harder. |
Does your goal change it?
Yes, in how the hard share is spent, though the easy base stays large for every running goal in the evidence. This covers running only. Other sports, strength training and hybrid events such as Hyrox were not reviewed here.
- General health or just getting moving: health guidelines are written as minutes of moderate activity, not zones [49]. You do not need to measure anything. The talk test is enough, and the rest of this article is optional.
- 5K and 10K: the trials above were mostly 5 to 10 km outcomes and favored mixes with mostly easy running [41][42][45]. World-class track runners also shift toward more high-intensity work as competition nears [46].
- Half marathon and marathon: marathon data show volume and easy share matter most, with pyramidal the usual pattern [44]. World-class marathoners do more upper-moderate running specific to race pace as the race approaches [46].
- Ultramarathon: the evidence is thin. The only study found was a single-athlete case study of an elite female ultrarunner, whose intensity distribution moved from polarized toward pyramidal during a 29-week build [50]. One athlete cannot be generalized, so treat ultra advice as extrapolation from marathon research.
Putting it into your protocol
- Find your easy ceiling using Part 3. Treat it as a ceiling, not a target.
- Make most of your runs easy (roughly 70 to 85 percent of your week, as above) and keep them under that ceiling, even when you feel good.
- Add a small share of harder work that fits your goal: intervals if you want speed, tempo or race-pace work if you are building toward a longer race. Keep hard days hard and easy days easy.
- Build volume gradually. The evidence above describes what fast runners do after years of building, and it is not where to start.
- Re-check your zone every four to six weeks, and adjust the mix as your goal gets closer.
Part 3: Finding your zone (everyone)
Part 3 gives you a way to turn Part 1 into a number you can use, which is the ceiling Part 2 tells you to respect. Pick the rung of the ladder that fits your situation, then use the checks together.
If you have access to testing
The strongest option is a lab test that measures either gas exchange (VT1) or lactate across stages, ideally interpreted by someone who tells you which threshold definition they used. Because definitions differ, ask. If you get a heart rate and a pace at your first threshold, treat that as your upper Zone 2 boundary, then retest every few months as fitness changes.
Can you run your own lactate test?
Yes, partly. A handheld lactate meter and test strips cost a fraction of a lab visit, and the research on them is better than many people assume. A systematic review of 25 studies found portable analyzers correlated strongly with laboratory methods (r = 0.95 to 0.99) and had high reliability (ICC above 0.90, coefficient of variation under 5 percent), with several models over- or under-reading above about 6 mmol/L. Its authors concluded that portable analyzers show strong reliability and moderate-to-high validity, and noted little data on female and youth participants [28]. A separate comparison of six handheld analyzers found no single device both highly accurate and reliable across the whole range, bias was the main source of error, and the within-sample variation was mostly under 0.5 mmol/L between about 1 and 10 mmol/L. The authors also found biological variation in lactate was much larger than analyzer error, so a device you use consistently can track your own changes over time. That study used venous blood from five people in a lab, so field results may differ [29].
A typical protocol (described by a running coaching site, not a validated standard): warm up 15 to 20 minutes, then run progressive stages of 3 to 4 minutes starting very easy, taking a fingertip sample at the end of each stage and watching for lactate rising above about 2 mmol/L [31]. A treadmill study of 94 male runners found that starting the first stage at 70 percent of recent race speed kept first-stage lactate below 2 mmol/L in 99 percent of them, while starting at 90 percent was too fast for most [30]. That study used 4-minute stages, 1.5 km/h steps and a lab treadmill, not a track.
What the DIY version can and cannot do:
- It can show you the heart rate and pace where your lactate first lifts off its baseline, which is what a first-threshold estimate looks for.
- It cannot settle the definition question. A fixed 2.0 mmol/L line and a "first rise above baseline" can land at different paces, and a lab report that says "LT1" may use either [5][12].
- No study was found validating a track-based, self-administered protocol against laboratory testing in runners, so treat the result as an estimate, repeat it under similar conditions, and compare it with the talk test and drift test below.
- Follow the meter manufacturer's instructions for sampling, strips and storage, because the studies above show device choice and technique matter. Use the same meter every time.
What this means for you: a meter can turn "I think my Zone 2 is around 150" into "my lactate stayed near baseline up to about this pace and heart rate." That is a real upgrade over a formula, as long as you treat it as a good estimate and cross-check it.
If you do not have access to testing
You are not stuck. You can build a defensible estimate with several cheap checks and favor the conservative answer when they disagree. Seiler has stressed the importance of not overestimating the first threshold [22].
- Use the talk test on every easy run. You should be able to speak full sentences comfortably. If you can only manage short phrases, you are probably above your first threshold [15]. Remember that it can run slightly generous [16]. You learn: a heart rate and pace ceiling that feels right.
- Try a heart rate drift test. Uphill Athlete's protocol: warm up for 10 to 15 minutes, hold a constant pace for 60 minutes on a treadmill at a 2 to 3 percent grade, then compare the average heart rate of the first half with the second. Under 5 percent drift suggests you were below your aerobic threshold; over 5 percent suggests you were above it. Retest every four to six weeks [11]. This is a coaching organization's method, and it says it correlates well with lab testing, but no independent validation was found, so use it as a guide rather than a verdict. Separate research in 51 trained cyclists found that heart rate and breathing decoupling during controlled sessions may be a practically useful way to assess durability, which supports the general idea that drift carries information [23]. You learn: whether your talk-test pace holds up for an hour.
- Treat nose breathing as a daily check, not a test. Uphill Athlete notes that for athletes who are significantly aerobically underdeveloped, comfortable nose breathing can occur above the real threshold, giving false reassurance [11]. You learn: a quick sanity check, never a measurement.
- If you have a chest strap and a compatible app, consider HRV-based thresholds. The DFA a1 method above has solid early support, but it is newer than the other options [18][19]. You learn: an independent estimate of your first threshold.
- Do not use the 30-minute "lactate threshold heart rate" test to set Zone 2. That test estimates a much harder effort, roughly what you can sustain for an hour, which is closer to the upper threshold. Zone 2 sits well below it.
- Treat any number as a hypothesis. Check it against how the run feels, how much your heart rate drifts, and how you recover over the following 24 hours.
A sequence you can follow
This is a practical way to combine the checks above. It is built from the studies and coaching protocols cited in this article, and it is not itself a validated protocol.
- Weeks 1 to 2: on every easy run, use the talk test. Note the heart rate and pace where you can still speak in full sentences. That range is your first estimate.
- Week 2 or 3: do the 60-minute drift test at the upper end of that range. Compare first-half and second-half average heart rate.
- Compare. If the drift is under 5 percent, your estimate holds. If it is over 5 percent, drop the pace a little and repeat. If the checks disagree, go with the lower number.
- Set a ceiling, not a target. Anything at or below your ceiling counts as easy aerobic running. You do not have to sit exactly at it.
- Retest every four to six weeks as fitness changes [11], and any time your training or life circumstances change a lot.
A final practical point on forum numbers: the heart rate someone else reports tells you almost nothing about yours. Age, genetics, fitness, sex, hydration, heat, medications and recovery state all move the result, and the research above shows the gap between people at the same fixed percentage can be large [5][8][9]. If you take medications that affect heart rate, talk with your doctor before relying on any heart-rate-based target.
Part 4: For women only (menstrual cycle, perimenopause and postmenopause)
Skip this part if it does not apply to you. Everything in Parts 1 to 3 applies to everyone. This part covers how female physiology may change what Zone 2 looks like, and it is more cautious than the rest because most Zone 2 research was done on men or mixed groups. The findings below come mostly from small studies, so treat them as direction, not rules. Partners, coaches and curious readers are welcome to read on.
Women and heart rate zones in general
What the research says. In the 100-person study above, the lactate threshold came at a higher percentage of max heart rate in women than in men [8]. Predicting max heart rate also differs: a 2010 study of 5,437 healthy women aged 35 and older produced the women-specific formula 206 minus 88 percent of age, which gives a lower peak than "220 minus age" (at age 50, 162 versus 170 beats per minute) [32]. It is still a population average, so it does not remove individual differences.
What this means for you: if your watch builds zones from "220 minus age," it may start from a max that is too high, and a fixed percentage may sit below your actual threshold. A measured max, or a threshold-based method like the ones in Part 3, avoids both problems.
The menstrual cycle
What the research says. In 28 active women who ran treadmill tests in different cycle or contraceptive phases, heart rate, blood lactate and oxygen uptake at the aerobic and anaerobic thresholds did not change significantly across phases. Heart rate at the thresholds tended to be higher in hormonal contraceptive users than in women with natural cycles, with medium to large effect sizes, and the study could not establish why. The authors recommend recording cycle or contraceptive phase when testing and prescribing heart-rate-based training individually [33]. A 2025 meta-analysis of 35 studies (743 participants) found ventilation during submaximal exercise was lower in the follicular phase than the luteal phase, a large effect, and linked it to progesterone changes. It did not measure heart rate or thresholds, and nobody has shown that this changes the talk test [34].
What this means for you:
- Do not expect your threshold to swing dramatically through the month. The one treadmill study found no systematic change.
- If easy runs feel more breathless in some weeks, that may be a ventilation effect and not lost fitness. That is a reasonable reading of the meta-analysis, not a proven rule, so judge by heart rate, pace and recovery together.
- When you test, note where you are in your cycle or whether you are on hormonal contraception, so you compare like with like. Do not copy a friend's zone numbers if one of you uses hormonal contraception and the other does not.
Perimenopause and postmenopause
What the research says. A 2025 cross-sectional study of 69 physically active women aged 18 to 60 grouped them as premenopausal, late premenopausal, perimenopausal and postmenopausal. Measured VO2peak and ventilatory thresholds (VT1 and VT2) did not differ between groups, and each threshold sat at a similar percentage of VO2peak. Maximal heart rate fell across the groups (184 beats per minute premenopausal versus 165 postmenopausal), and heart rate at VT1 was lower in postmenopausal women (103 versus 123), but the percentage of max heart rate at each threshold did not differ. The authors concluded that fitness changes in menopause may depend more on physical activity than on menopausal status. Limits: small convenience sample, cross-sectional rather than following women over time, hormone therapy and contraceptive users included, and age and menopause stage are tangled together [35].
What this means for you:
- Your absolute heart rate numbers will likely drift lower with age, so a Zone 2 number that was right at 35 may be too high at 58. Re-find it rather than carrying it forward.
- In that study, the percentage of max heart rate at each threshold held steady. A percentage of a measured max may therefore travel better across the years than an absolute number, though this is one small study, so keep checking with the talk test and drift test.
- Staying active appeared to matter more than menopause stage for aerobic capacity in this sample, which is an encouraging finding but not proof of cause.
Fat burning and the training response after menopause
What the research says. In a study of 41 women (19 premenopausal, 8 perimenopausal and 14 postmenopausal) who cycled for 45 minutes at 50 percent of VO2max, postmenopausal women had about 33 percent lower whole-body fat oxidation. After adjusting for lean body mass the gap shrank to about 23 percent and was borderline significant (P = 0.05), and the authors linked the difference to lower lean mass [36]. A smaller 2022 study (12 pre- and 12 postmenopausal women of comparable BMI, but average ages of about 25 versus 58) found postmenopausal women's respiratory quotient kept rising during 30 minutes at a moderate load instead of falling, which the authors read as less fat use, and the paper has internal inconsistencies in its participant counts [37]. These are small studies, and age differs a lot between the groups. Separately, in 251 postmenopausal women assigned to 6 months of supervised cycling or treadmill training at the heart rate associated with 50 percent of baseline VO2peak, women under 60 improved VO2peak significantly at the higher doses while women over 60 did not. The authors note that intensity alone does not guarantee a response [38]. That study used a moderate target intensity, not Zone 2 as defined above.
What this means for you:
- Zone 2 is defined by lactate, not by fat burning, so this does not mean easy aerobic work stops being useful. It does mean "fat-burning zone" is a weaker label after menopause, so do not choose your effort by it.
- Because the fat oxidation gap was tied partly to lower lean mass, keeping muscle is a sensible response. Those studies did not test strength training, so this is a reasonable inference and not a finding.
- If your fitness stalls on easy running alone, the training-response study suggests dose and intensity may need adjusting for you, which is a good conversation to have with a coach.
- No study was found that tested Zone 2 as popularly defined in postmenopausal runners, so be wary of anyone claiming a definitive postmenopausal Zone 2 prescription.
A note on safety. Talk with your doctor before relying on heart-rate targets if you take hormone therapy, blood pressure medication or anything else that affects heart rate. Reviews also flag a data gap: the portable lactate analyzer review noted little data on female participants [28].
Part 5: How Fit PA can help
Fit PA is an AI training coach for any goal, from getting moving to the 5K, to ultras and Hyrox. It cannot measure lactate or breathing gases, so it cannot replace a lab test, and it does not claim to. What it can do is make the field-testing approach in Part 3 far easier to carry out and learn from. Here is how it lines up with the steps above:
- Step: gather your numbers. Your data in one place. Fit PA syncs with Garmin, Coros, Suunto, Polar, Wahoo, Apple Watch and Health Connect, so the heart rate and pace from your real runs are already there. You do not need to keep notes.
- Step: run the drift check. See your zones and drift. The analytics page shows your heart rate zone distribution over time, and each activity includes a zone comparison with a pace and heart rate toggle that colors every split by relative zone. On a steady-pace run, later splits creeping into a higher zone is easy to spot.
- Step: judge whether a bad number is a bad day or a changed threshold. Context beyond heart rate. HRV, resting heart rate and sleep trends are on the dashboard, which helps you tell a rough day from a real change.
- Step: interpret and adjust. A coach, not a chatbot. The Fit PA coach is built to reason like a coach would. It works from your synced training data, biometrics, goals, plan and health file (including any niggles you have told it about) before it answers, and it changes the plan when your data says it should. You can ask it to build a steady aerobic test into your plan, tell it your lactate meter or talk-test results, and talk through what a run showed. It builds hard and easy structure into your plan automatically, so easy days stay easy and hard sessions are spaced out.
- Step: choose your mix. A plan built around your goal. The coach builds your plan around your goal, current level and schedule, so how much of your week is easy and how much is harder is decided with you, not guessed. Fit PA does not claim that any one split, such as 80 percent easy, is proven for you; the research in Part 2 shows a range, and your data and the plan adjust within it.
- Step: keep it current. Plans that follow you. Workouts are pushed to your watch and the plan updates as your training actually unfolds, including through the training changes that come with age and life stage.
- Step: fuel the work. Nutrition that works with the plan. Fit PA's nutrition tracking sits inside the same adaptive plan. Your daily calorie target scales with scheduled training load, and it recommends eating more in the window before and after long, hard sessions to replenish glycogen, which matters most on back-to-back long days. You can log meals by typing, voice, a photo of your plate, a barcode scan or manual entry.
- Step: look at how you move. Form analysis. Fit PA's form analysis looks at how you move. Technique is one of several factors researchers study in running economy, the oxygen cost of running at a given pace, so it can indirectly connect to how efficient you feel at easy effort. Fit PA does not measure running economy and does not claim that a form change will improve yours.
Fit PA is a fitness coaching tool, not a medical device, and does not provide medical advice.
The bottom line
Zone 2 is a metabolic region just under your first threshold, not a heart rate, and "Zone 2" means different things on five-, six- and seven-zone systems. Fixed percentages and age formulas are starting points with wide error, and women's physiology adds more reasons to individualize, from sex differences to menopause. Easy running should make up most of your week, roughly 70 to 85 percent in the studies of runners from 5K to the marathon, with a smaller share of harder work for speed; the exact mix depends on your level and goal, and no study shows Zone 2 alone is enough to get faster. Lab testing gives the best answer, a portable lactate meter is a cheaper but imperfect way to estimate it yourself, and several free checks can get you close. The science on how much Zone 2 deserves its reputation is still being argued, which is a good reason to treat it as one tool among several, not the whole toolbox.
So the practical takeaway is simple: find your own number with the ladder in Part 3, re-check it as you train and age, and let the number serve the effort, not the other way round.
Sources
- Garmin. About Heart Rate Zones (device manual). https://www8.garmin.com/manuals-apac/webhelp/fenix6proseries/EN-SG/GUID-6B9EB233-9B22-4233-8CD4-699A3CA85A61-2123.html
- Seiler and Kjerland three-zone model, as summarized in Ultrarunning Magazine, "Training Zones: Behind the Numbers." https://ultrarunning.com/featured/training-zones-behind-the-numbers/
- The5krunner, "Heart Rate Training Zones: Finding the Real Thresholds." https://the5krunner.com/sports-science/training-zones/
- San Millán I. "Zone 2 Is a Metabolic Equilibrium Point." https://inigosanmillan.substack.com/p/zone-2-is-a-metabolic-equilibrium
- Storoschuk KL, Moran-MacDonald A, Gibala MJ, Gurd BJ. Much Ado About Zone 2: A Narrative Review Assessing the Efficacy of Zone 2 Training for Improving Mitochondrial Capacity and Cardiorespiratory Fitness in the General Population. Sports Med. 2025. https://doi.org/10.1007/s40279-025-02261-y
- TrainAsOne. Maximum Heart Rate. https://trainasone.com/faqs/2022/maximum-heart-rate
- An exploratory study of maximal heart rate determination in endurance athletes: laboratory testing vs. field based. https://sponet.de/sponet/Record/4097777
- Iannetta D, et al. A Critical Evaluation of Current Methods for Exercise Prescription in Women and Men. Med Sci Sports Exerc. 2020;52(2):466-473. https://pubmed.ncbi.nlm.nih.gov/31479001/
- Meixner B, Filipas L, Holmberg HC, Sperlich B. Zone 2 Intensity: A Critical Comparison of Individual Variability in Different Submaximal Exercise Intensity Boundaries. Transl Sports Med. 2025. https://pubmed.ncbi.nlm.nih.gov/40225831/
- Stevenson JD, Kilding AE, Plews DJ, Maunder E. Prolonged cycling reduces power output at the moderate-to-heavy intensity transition. Eur J Appl Physiol. 2022;122:2673-2682. Summary: https://pezcyclingnews.com/toolbox/durability-and-fatigue-with-prolonged-cycling/
- Uphill Athlete. Are You Actually Getting Fitter? Simple Field Tests for Mountain Athletes (April 2026). https://uphillathlete.com/aerobic-training/are-you-actually-getting-fitter-simple-field-tests-for-mountain-athletes/
- Jamnick NA, Botella J, Pyne DB, Bishop DJ. Manipulating graded exercise test variables affects the validity of the lactate threshold and VO2peak. PLoS ONE. 2018;13:e0199794 (cited in reference 5).
- Attia P and San Millán I. Episode 201 show notes. https://peterattiamd.com/?p=17624
- Methods of prescribing relative exercise intensity: physiological and practical considerations. Sports Med. https://pubmed.ncbi.nlm.nih.gov/23620244/
- ACE-sponsored research: Validating the Talk Test as a Measure of Exercise Intensity. https://www.acefitness.org/certifiednewsarticle/888/ace-sponsored-research-validating-the-talk-test-as-a-measure-of-exercise-intensity/
- Quinn TJ, Coons BA. The Talk Test and its relationship with the ventilatory and lactate thresholds. J Sports Sci. 2011;29:1175-1182. https://doi.org/10.1080/02640414.2011.585165
- Is a threshold-based model a superior method to the relative percent concept for establishing individual exercise intensity? https://pubmed.ncbi.nlm.nih.gov/26146564
- Rogers B, Giles D, Draper N, Hoos O, Gronwald T. A New Detection Method Defining the Aerobic Threshold for Endurance Exercise and Training Prescription Based on Fractal Correlation Properties of Heart Rate Variability. Front Physiol. 2021. https://doi.org/10.3389/fphys.2020.596567
- Agreement Between Heart Rate Variability-Derived vs. Ventilatory and Lactate Thresholds: A Systematic Review with Meta-Analyses. Sports Med Open. 2024. https://link.springer.com/article/10.1186/s40798-024-00768-8
- San-Millán I, Brooks GA. Assessment of Metabolic Flexibility by Means of Measuring Blood Lactate, Fat, and Carbohydrate Oxidation Responses to Exercise in Professional Endurance Athletes and Less-Fit Individuals. Sports Med. 2018;48(2):467-479. https://pubmed.ncbi.nlm.nih.gov/28623613/
- Durability is improved by both low and high intensity endurance training. Front Physiol. 2023. https://www.frontiersin.org/articles/10.3389/fphys.2023.1128111/full
- Fast Talk Labs. Applying the Polarized Training Model, with Dr. Stephen Seiler (episode 54). https://www.fasttalklabs.com/fast-talk/applying-the-polarized-training-model-with-dr-stephen-seiler/
- Rothschild JA, Maunder E. Durability of the Moderate-to-Heavy Intensity Transition Can Be Predicted Using Readily Available Markers of Physiological Decoupling. Eur J Appl Physiol. 2025;125. https://openrepository.aut.ac.nz/items/8e2279d5-f66d-48a7-9c0b-28140c4d6a8f/full
- COROS. COROS Heart Rate Zones: The Ultimate Guide. https://coros.com/stories/coros-metrics/c/coros-heart-rate-zones-the-ultimate-guide
- Suunto. Intensity zones (Suunto 5 support page). https://www.suunto.com/Support/Product-support/suunto_5/suunto_5/features/intensity-zones/
- TrainingPeaks. Power Training Levels (Coggan seven-level model). https://trainingpeaks.com/blog/power-training-levels
- Road Cycling UK. Six things you need to know about training zones, page 2. https://roadcyclinguk.com/how-to/six-things-need-know-training-zones.html/2
- Validity and reliability of portable blood lactate analyzers: A systematic review with COSMIN and GRADE assessment (25 studies). https://sponet.de/sponet/Record/4097860?lng=en
- Bonaventura JM, Sharpe K, Knight E, Fuller KL, Tanner RK, Gore CJ. Reliability and Accuracy of Six Hand-Held Blood Lactate Analysers. J Sports Sci Med. 2015;14:203-214. https://jssm.org/jssm-14-203.xml-Fulltext
- Dantas JL, Doria C. Detection of the Lactate Threshold in Runners: What is the Ideal Speed to Start an Incremental Test? J Hum Kinet. 2015;45:217-224. https://johk.pl/wp-content/uploads/2023/03/10.1515_hukin-2015-0022.pdf
- Runners Connect. Lactate Testing: 4 Research-Backed Home Methods (protocol description only; a coaching site, not a study). https://runnersconnect.net/at-home-lactate-threshold-test/
- Gulati M, et al. Heart rate response to exercise stress testing in asymptomatic women: the St. James Women Take Heart Project. Circulation. 2010. https://pubmed.ncbi.nlm.nih.gov/20585008/ (formula and example as reported at https://www.sciencedaily.com/releases/2010/06/100628170928.htm)
- Taipale-Mikkonen RS, et al. Influence of Menstrual Cycle or Hormonal Contraceptive Phase on Physiological Variables Monitored During Treadmill Testing. Front Physiol. 2021;12:761760. https://www.frontiersin.org/articles/10.3389/fphys.2021.761760/full
- Rattley CA, et al. Ventilation differences in the menstrual cycle: A systematic review and meta-analysis. Respir Physiol Neurobiol. 2025;337:104468. https://eprints.bournemouth.ac.uk/41156/1/Rattley%20et%20al%20%282025%29%20Meta-analysis%20ventilation%20MC.pdf
- Rattley CA, et al. Aerobic capacity and cardiopulmonary variables are not different between premenopausal, late premenopausal, perimenopausal, and postmenopausal women. Physiol Rep. 2025;13:e70503. https://eprints.bournemouth.ac.uk/41348/
- Abildgaard J, et al. Menopause is associated with decreased whole body fat oxidation during exercise. Am J Physiol Endocrinol Metab. 2013;304:E1227-E1236. https://doi.org/10.1152/ajpendo.00492.2012
- Hofmann K, et al. Effects of Acute Aerobic Exercise on Fat Metabolism in Pre- and Postmenopausal Women of Comparable Body Mass Index. Dtsch Z Sportmed. 2022;73:235-240. https://www.germanjournalsportsmedicine.com/archive/archive-2022/issue-7/effects-of-acute-aerobic-exercise-on-fat-metabolism-in-pre-and-postmenopausal-women-of-comparable-body-mass-index
- Earnest CP, Blair SN, Church TS. Age attenuated response to aerobic conditioning in postmenopausal women. Eur J Appl Physiol. 2010;110(1):75-82. https://pmc.ncbi.nlm.nih.gov/articles/PMC2936264
- Seiler S. What is best practice for training intensity and duration distribution in endurance athletes? Int J Sports Physiol Perform. 2010;5(3):276-291. PubMed 20861519. Read via https://lida.sport-iat.de/ta/Record/4020753
- Stöggl TL, Sperlich B. The training intensity distribution among well-trained and elite endurance athletes. Front Physiol. 2015;6:295. https://www.frontiersin.org/journals/physiology/articles/10.3389/fphys.2015.00295/full
- Muñoz I, et al. Does polarized training improve performance in recreational runners? Int J Sports Physiol Perform. 2014;9(2):265-272. https://pubmed.ncbi.nlm.nih.gov/23752040/
- Filipas L, et al. Scand J Med Sci Sports. 2022;32(3):498-511 (16-week trial in well-trained runners comparing pyramidal and polarized distributions). https://pmc.ncbi.nlm.nih.gov/articles/PMC9299127/
- Training-intensity distribution on middle- and long-distance runners: a systematic review. Int J Sports Med. 2022;43(4):305-316. https://lida.sport-iat.de/ta/Record/4075045?lng=en
- Muniz-Pumares D, et al. Training characteristics of marathon runners (Strava data, 151,813 marathons). Sports Med. 2025;55(4). https://link.springer.com/article/10.1007/s40279-024-02137-7
- Esteve-Lanao J, San Juan AF, Earnest CP, Foster C, Lucia A. How do endurance runners actually train? Relationship between training intensity distribution and performance. Med Sci Sports Exerc. 2005. https://sponet.de/sponet/Record/4009696 (author names from the researcher's own knowledge, not the fetched page)
- Haugen T, Sandbakk Ø, Seiler S, Tønnessen E. The training characteristics of world-class distance runners: an integration of scientific literature and results-proven practice. Sports Med Open. 2022;8:46. https://pmc.ncbi.nlm.nih.gov/articles/PMC8975965/
- Helgerud J, et al. Aerobic high-intensity intervals improve VO2max more than moderate training (conference abstract, MSSE supplement, cited as 2006; abstract only). https://coachsci.sdsu.edu/csa/vol131/helgerud.htm
- Milanović Z, Sporiš G, Weston M. Effectiveness of high-intensity interval training (HIT) and continuous endurance training for VO2max improvements: a systematic review and meta-analysis of controlled trials. Sports Med. 2015. https://research.tees.ac.uk/en/publications/effectiveness-of-high-intensity-interval-training-hit-and-continu-3/
- World Health Organization. Physical activity fact sheet (150-minute moderate-intensity figure). https://www.who.int/news-room/fact-sheets/detail/physical-activity
- Reverse periodization in ultratrail: case study of an elite female ultrarunner. Current Issues in Sport Science. 2024;9(4). https://lida.sport-iat.de/ta/Record/4090440?lng=en